Helping participants track and improve their AI bots

Bhoos Games organized the SmartBots Coding Challenge, a four-month-long competition inviting developers and coding enthusiasts to build an AI bot for a card game.

To keep participants engaged throughout the competition, we designed a centralized dashboard, used by 870 participants across 725 teams to build, submit, and track their bots. Its strong impact led to the dashboard’s return in the second year with enhanced features and continued success.

Year

2022

Timeline

6 months

Role

UI/UX Design
My responsibility involved designing an user interface for the various features in the dashboard through extensive collaboration with the developers to ensure technical feasibility.

Challenge

How might we create a fun and competitive experience for participants in the SmartBots Coding Challenge?

To make the challenge engaging for participants, the dashboard needed to address several key challenges:

  1. A way for participants to track their performance and rankings in real-time.
  2. Insights for participants to improve their bots and refine their strategies.
  3. A secure way to test and submit their bot code.

The process

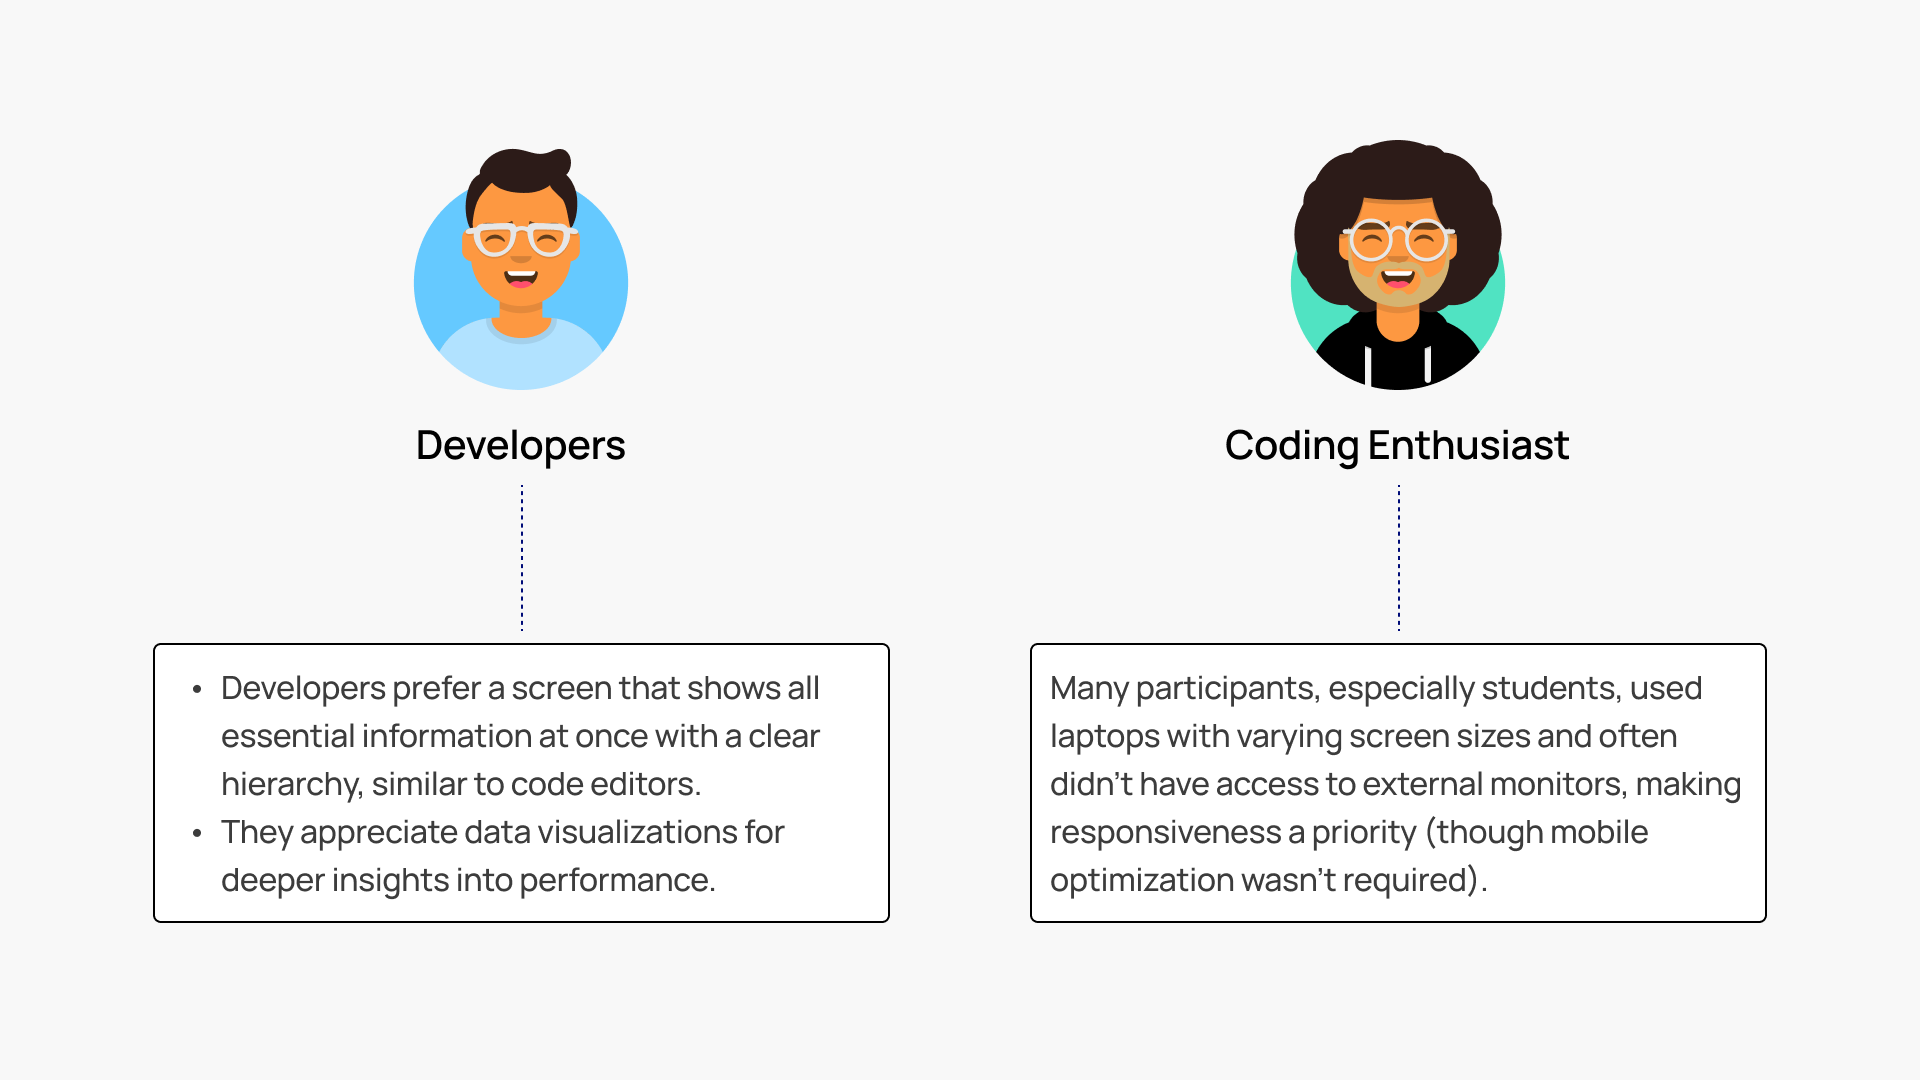
Designing the dashboard was a collaborative and iterative process, focused on understanding developer needs, defining objectives, and refining features based on internal feedback.

1. Requirements Gathering

Requirements were primarily brainstormed by the technical leads, with my contributions focusing on clarifying them through discussions.
Our primary users were developers and coding enthusiasts participating in the competition. Since we lacked direct access to participants during the design phase, we relied on feedback from internal developers to understand typical developer preferences.
Image showing the preferences of developers and coding enthusiast collected from the internal developers in the team.

Developers prefer a screen that shows all essential information at once with a clear hierarchy, similar to code editors.
They appreciate data visualizations for deeper insights into performance.

Many participants, especially students, used laptops with varying screen sizes and often didn’t have access to external monitors, making responsiveness a priority (though mobile optimization wasn’t required).

Objectives Defined:

  1. Enable participants to track progress and standings in real-time.
  2. Provide tools for analyzing bot performance.
  3. Ensure secure and seamless code submission.

2. Designing Features to Complement Objectives

The feature ideation process was iterative and heavily influenced by the technical team’s input. My role included:

  1. Ensuring the user interface was intuitive and user-friendly.
  2. Collaborating closely with developers to ensure feasibility and integrate feedback effectively.

3. Handoff and Implementation

The dashboard was built using Ant Design System with some customizations on colors and few components so the designs required annotations on which components to use and how.
Designs were delivered via Figma with detailed annotations specifying component use and behavior.
Image showing a screenshot from Figma file.Image showing developer handoffs in Figma

Solution

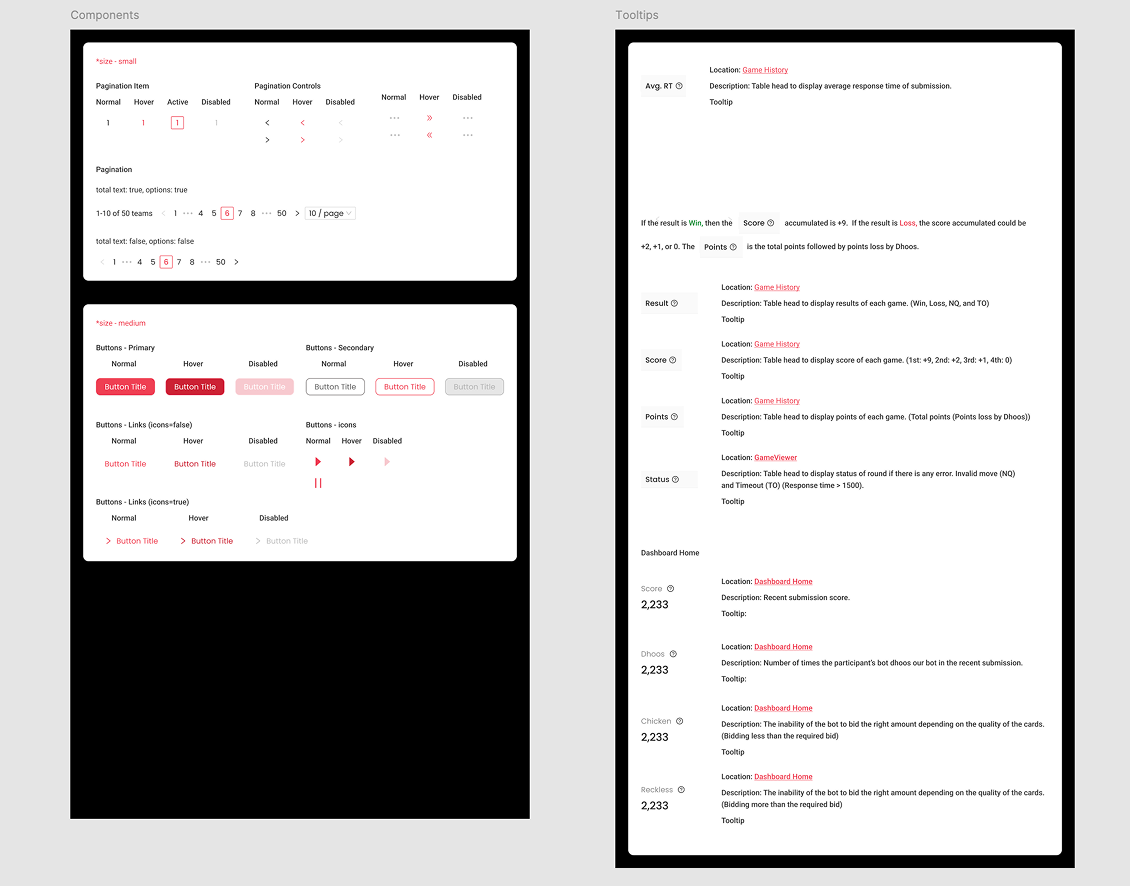
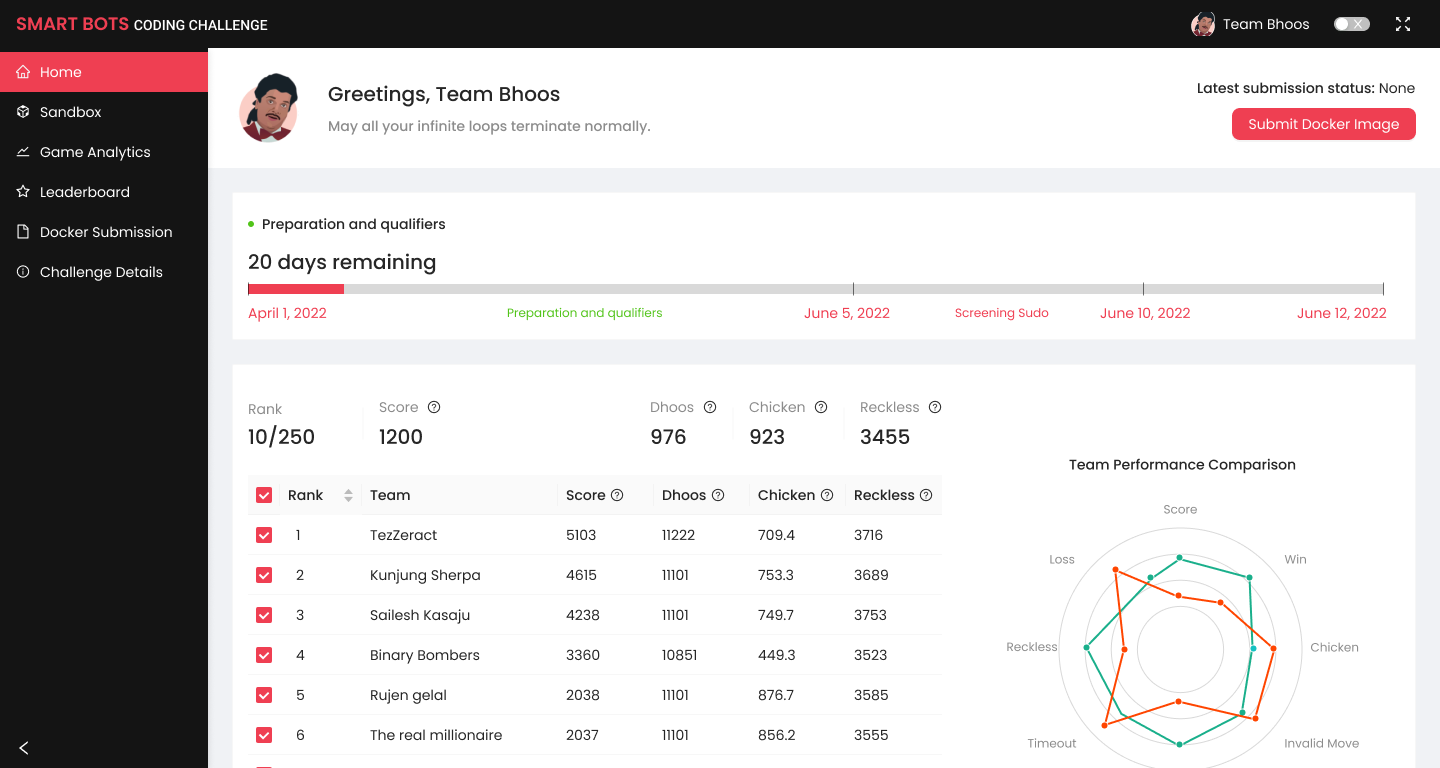
We designed a dashboard to keep participants engaged in the 4-month long competition and enable them to improve their bots at every stage.

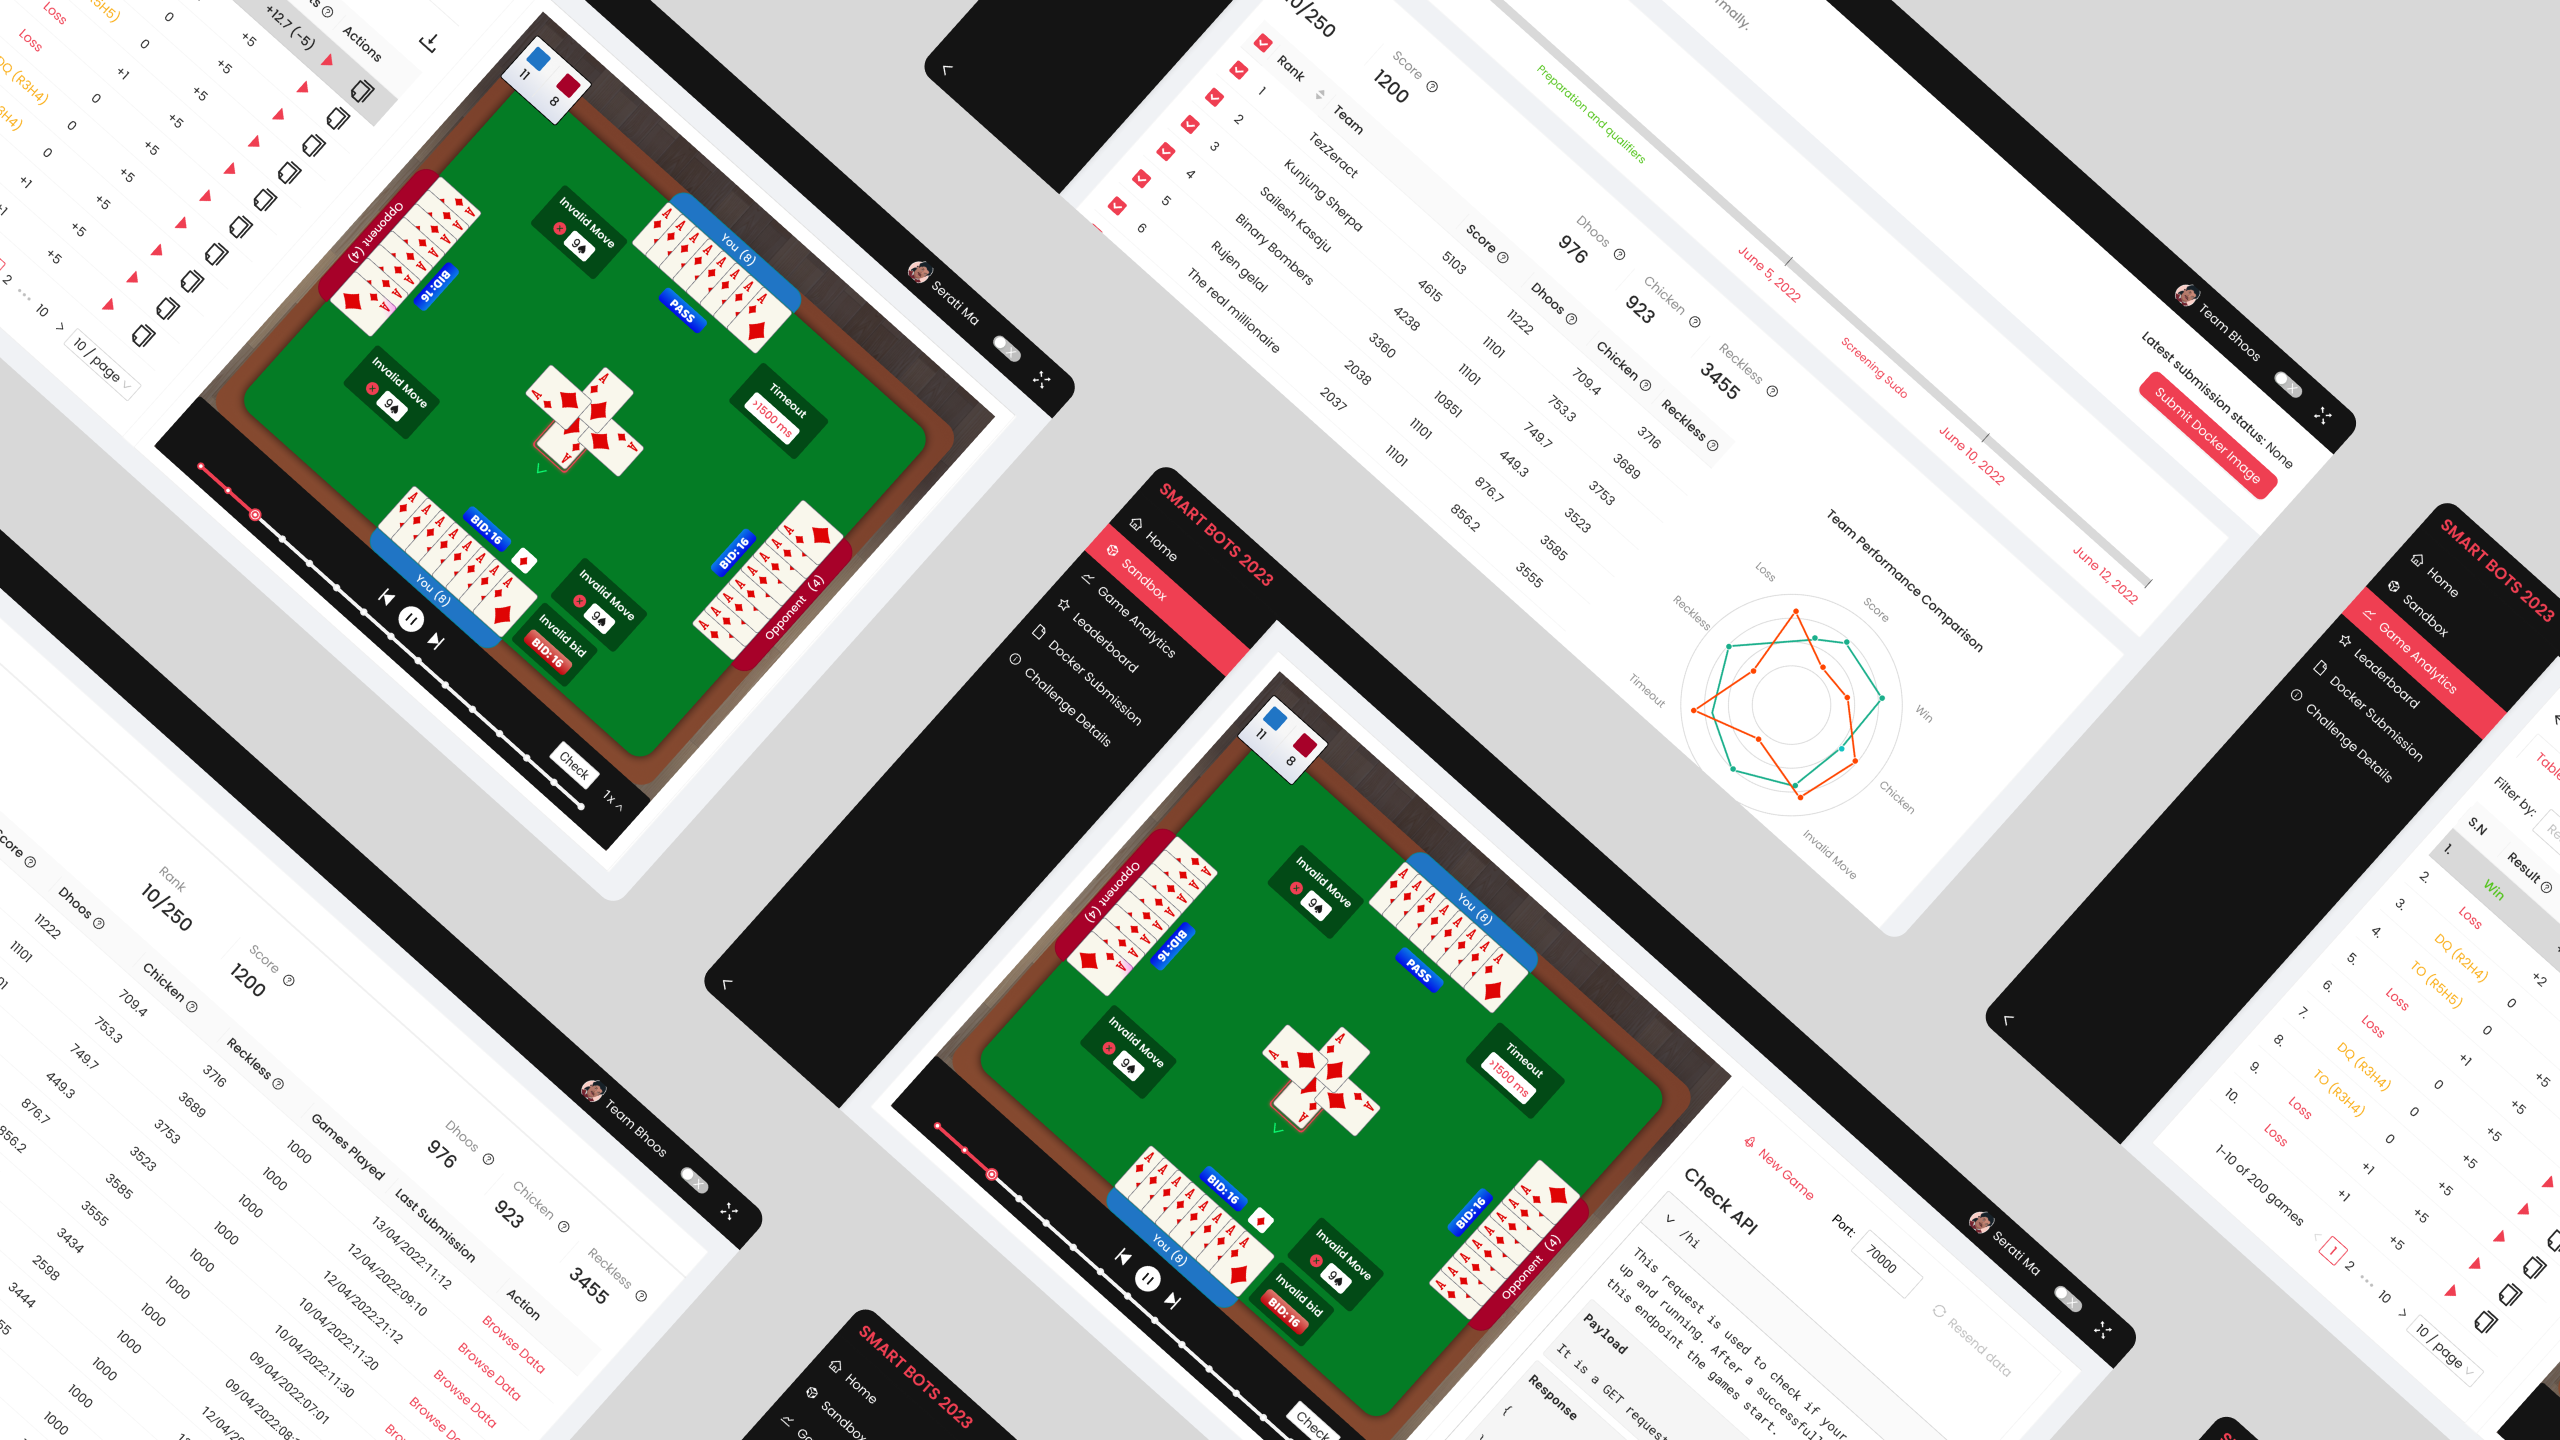
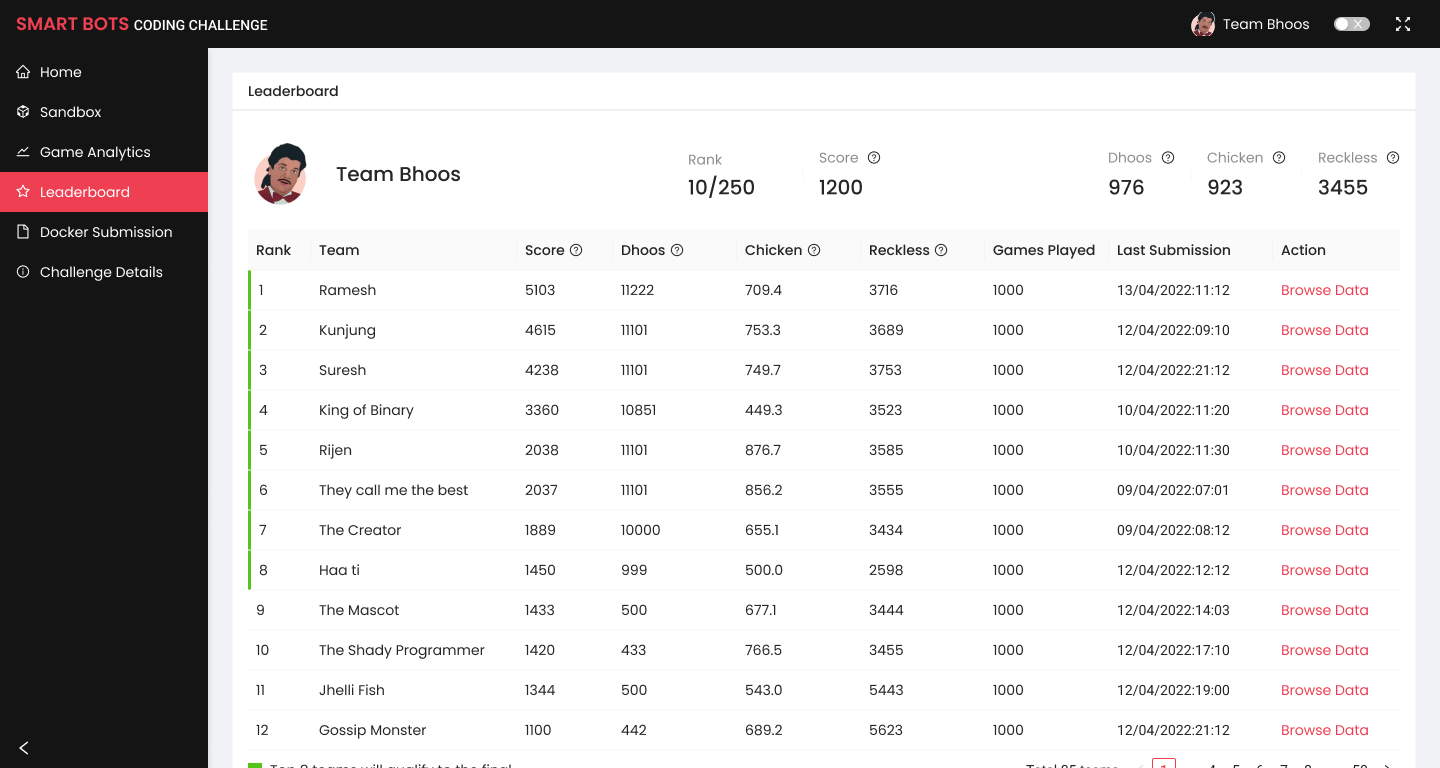
Dashboard Home allows participants to easily track and compare their performance with other competitors.

image showing the dashboard's home page. The home page features a timeline showing the key dates of the competition. It also features a leaderboard with an option to compare your rankings with your competitor's via graphs.

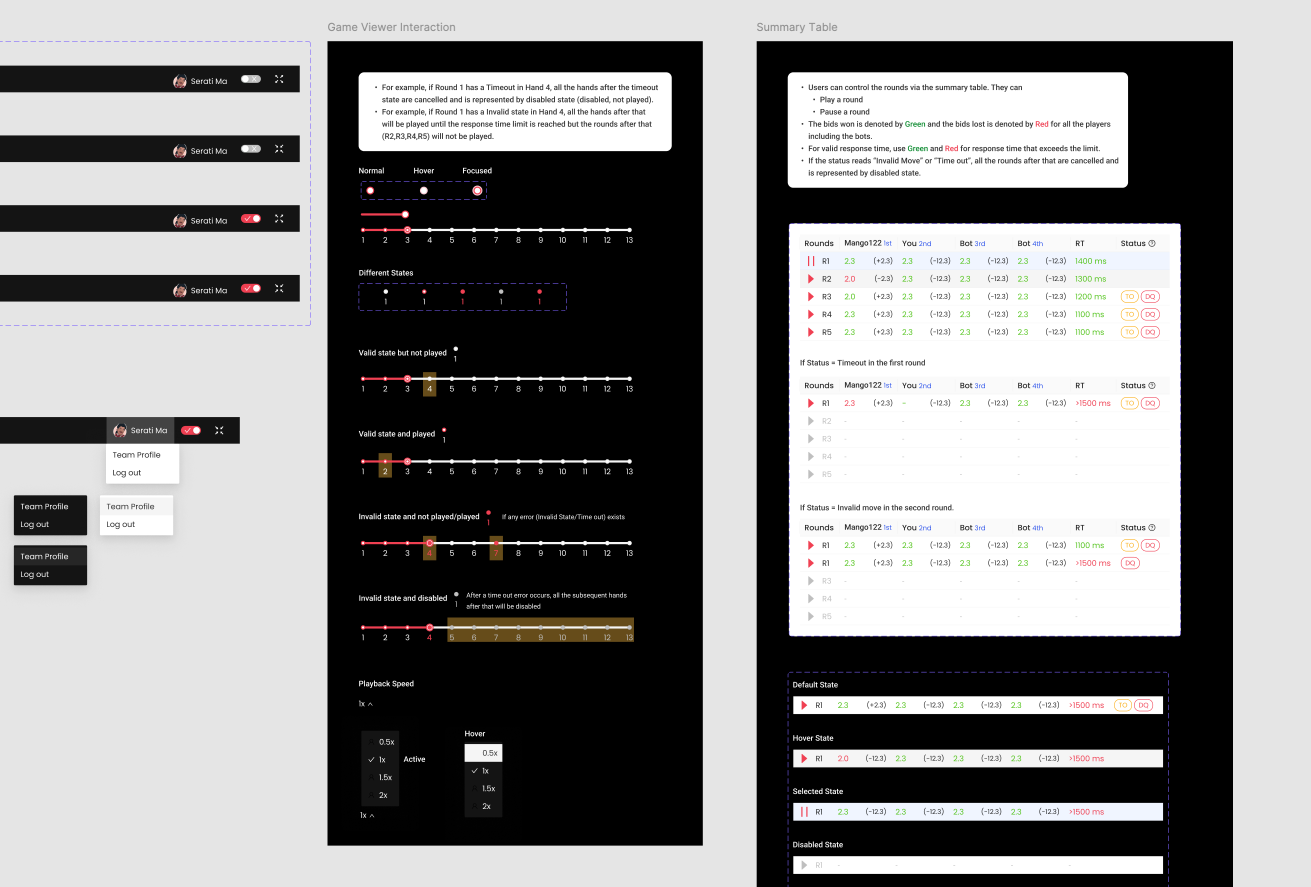
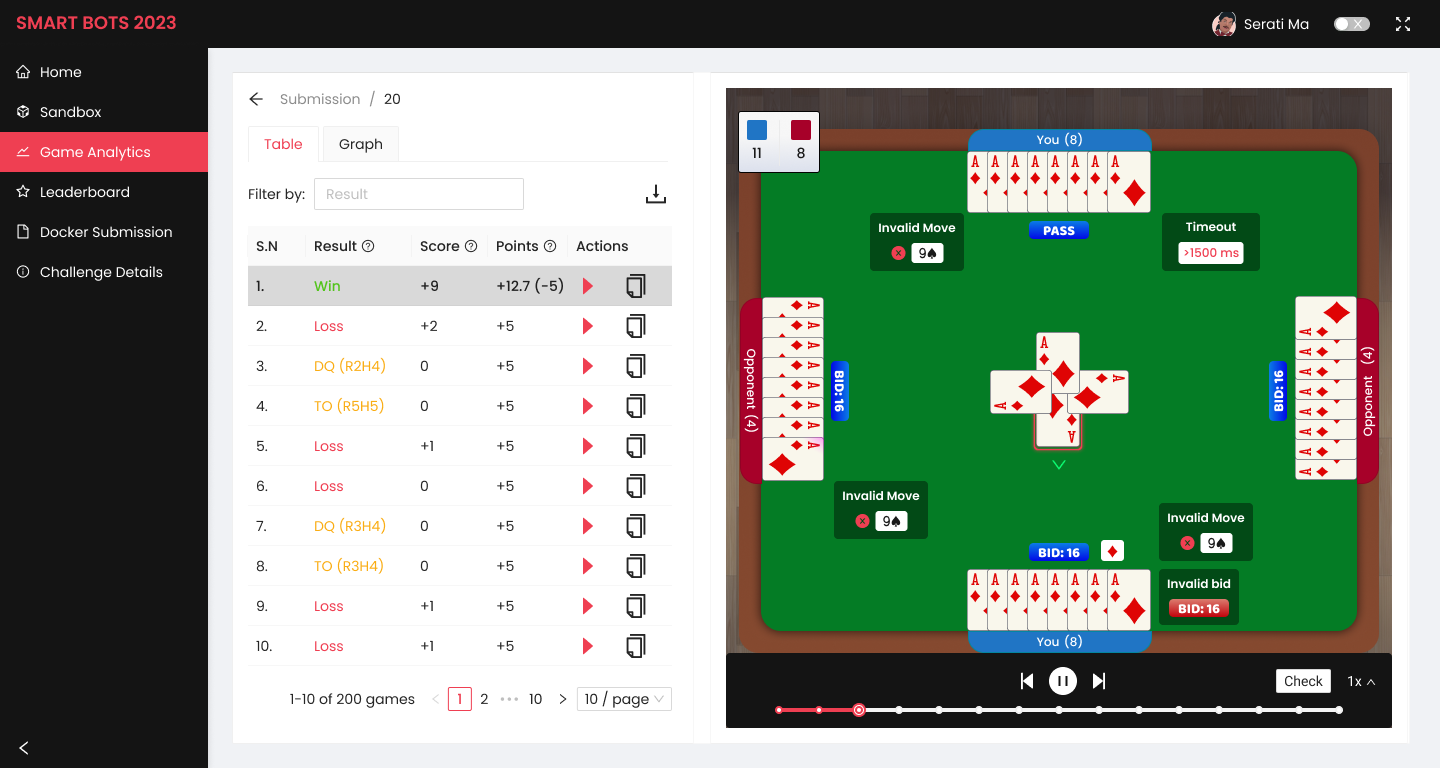
An intuitive analytics tab provides insights into bot performance across games, enabling participants to identify strengths and areas for improvement.

image showing the Game Analytics page of the dashboard. It features a list of games played by the bot with the scores, results, points, and a feature to play the game and see the minute details.

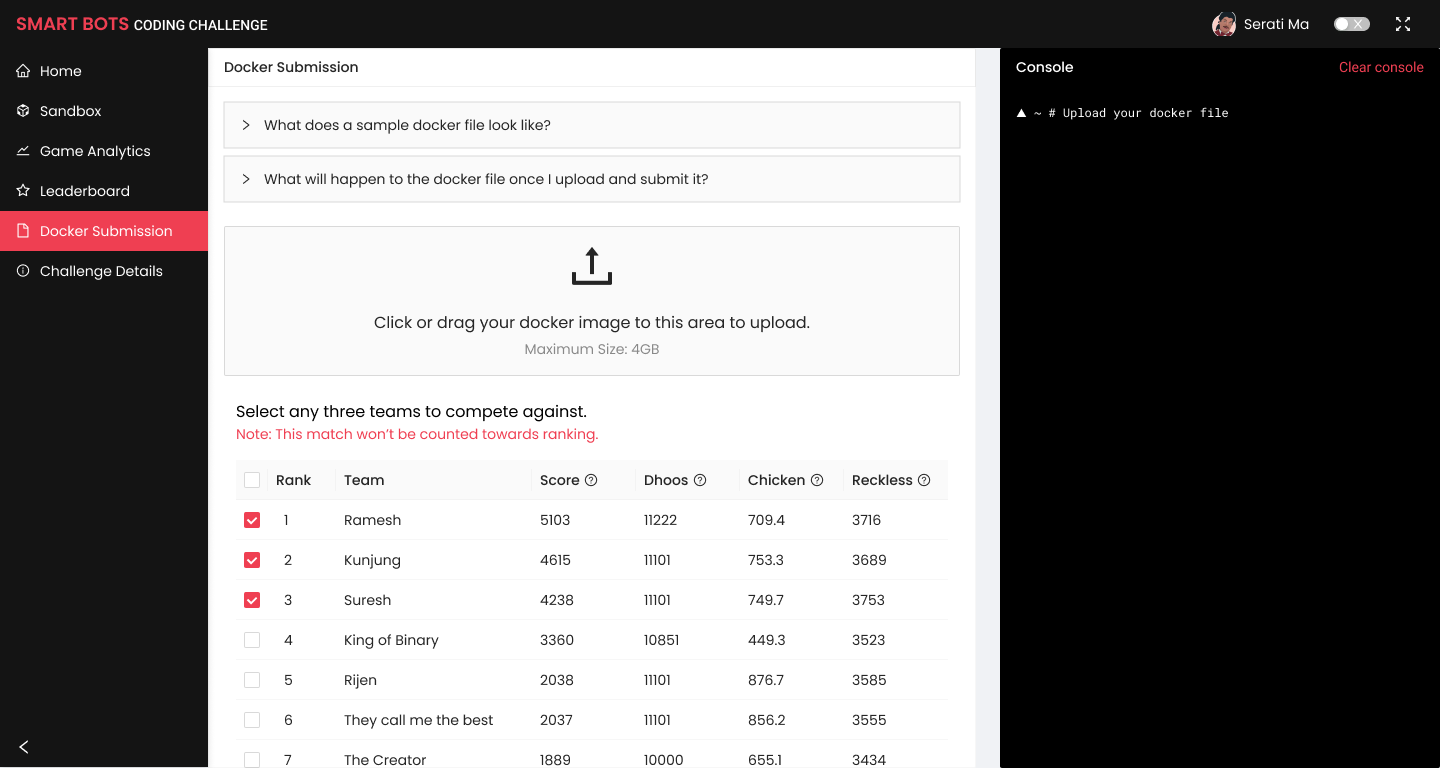
A Docker-based system ensures participants can submit and run their bot code safely on the server.

image showing the Docker Submission page of the dashboard.

Sandbox enables participants to test and optimize their bots without impacting official rankings.

Image showing the Sandbox page of the dashboard.

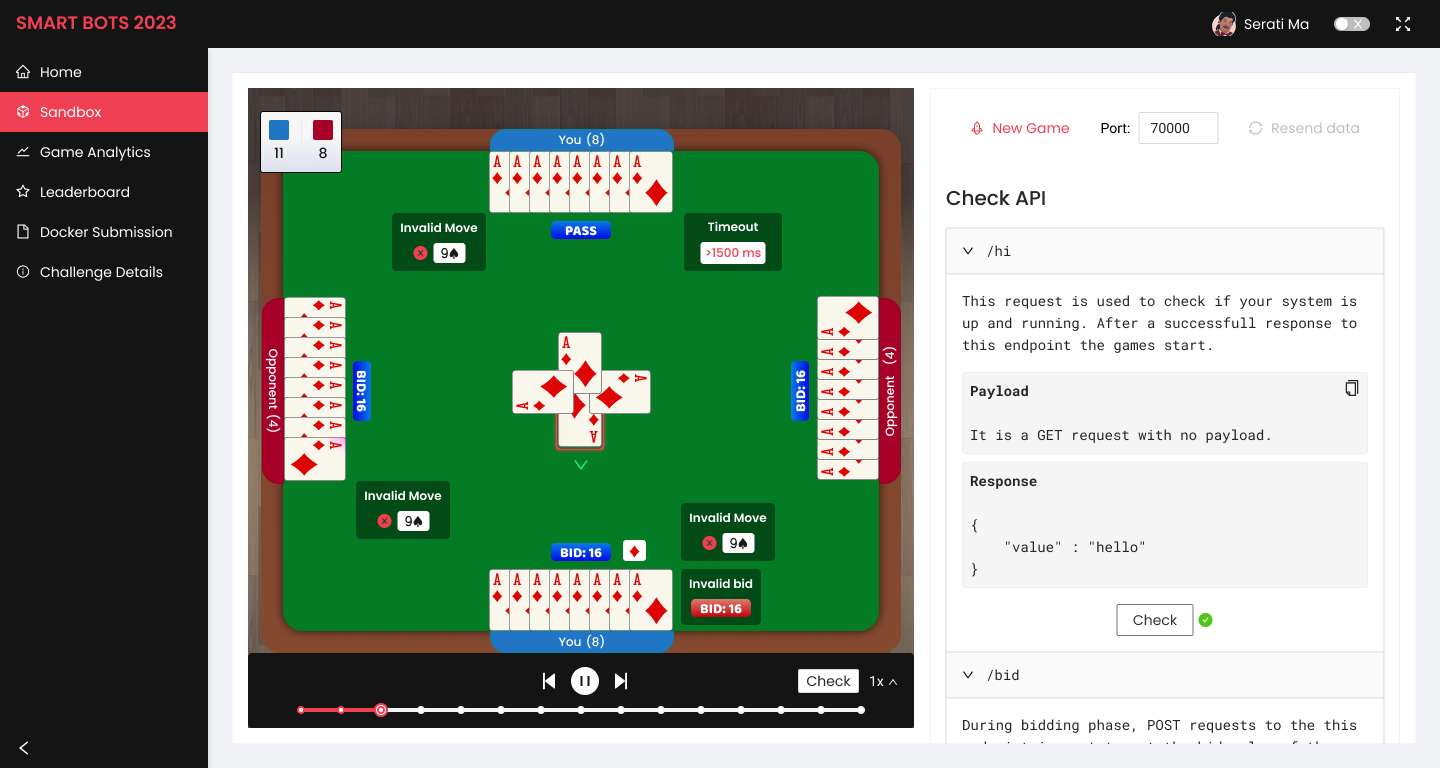
Leaderboard displays real-time rankings and detailed performance metrics to build the competitive energy.

Image showing the Leaderboard page of the dashboard.

Results

The dashboard played a crucial role in the success of the first SmartBots Coding Challenge. Although analytics on dashboard usage was not collected, we observed consistent interaction from participants as they tracked their performance and rankings.

For the competition’s second year, the dashboard was reused with several refined features, resulting in significant engagement and participation:

  1. 725 Teams comprising 870 Participants used the dashboard to build, submit, and track their AI bots throughout the competition.
  2. 94 Teams on the Leaderboard, where their progress and rankings were displayed for real-time tracking.
  3. 45 Teams in the Final Stage, showcasing the dashboard’s role in helping participants progress through the competition.

Lessons Learnt

  1. Value of Collaboration: Working with cross-functional teams, I learned how healthy conflicts and diverse perspectives can lead to better solutions.
  2. Responsive Design: Adapting designs for smaller laptop screens posed challenges, especially in data-heavy screens.
  3. Cater to diverse needs: Feedback revealed a missed opportunity in the dashboard to provide more guidance to participants, such as resources on building bots from scratch. This gap was partially addressed through a Discord channel, but the dashboard could have played a more central role in supporting beginners.

What's next?

Transforming field workflows from paper to digital

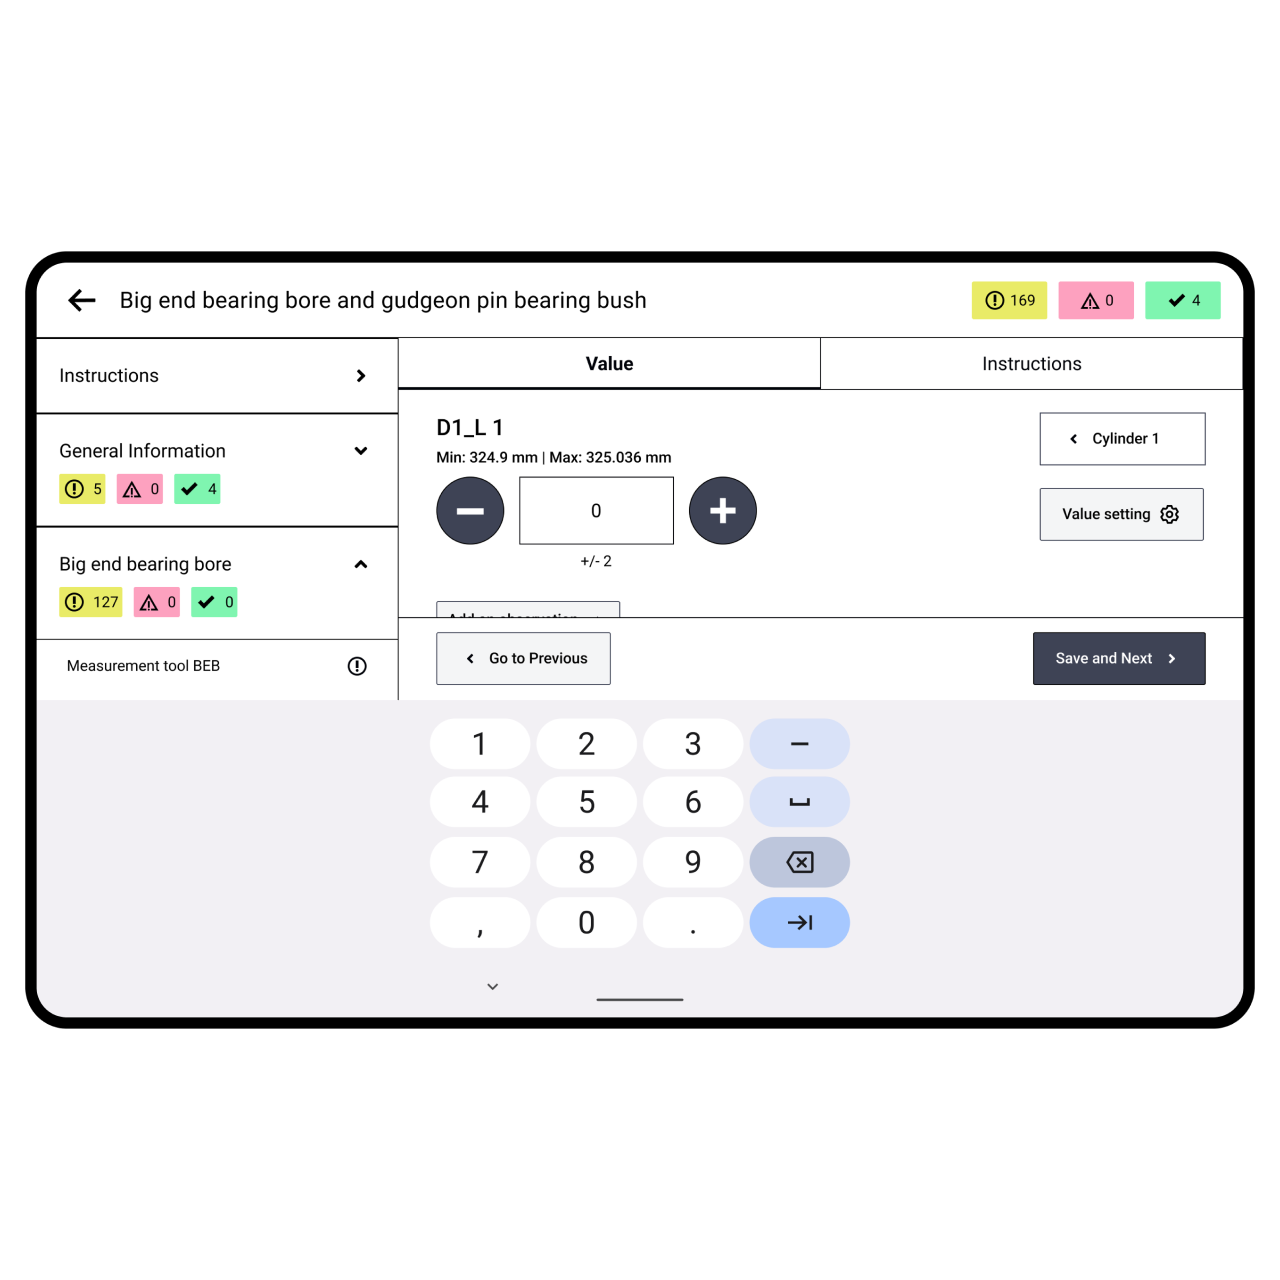
Industrial · User Research · Prototyping · Tablet Interface

A decorative image showing the tablet interface for recording data from the field.

Designing a website that captures togetherness

Gaming · UX Design · Information Architecture · Website

Image link takes you to the project details page.

Creating a digital space where brands meet creators

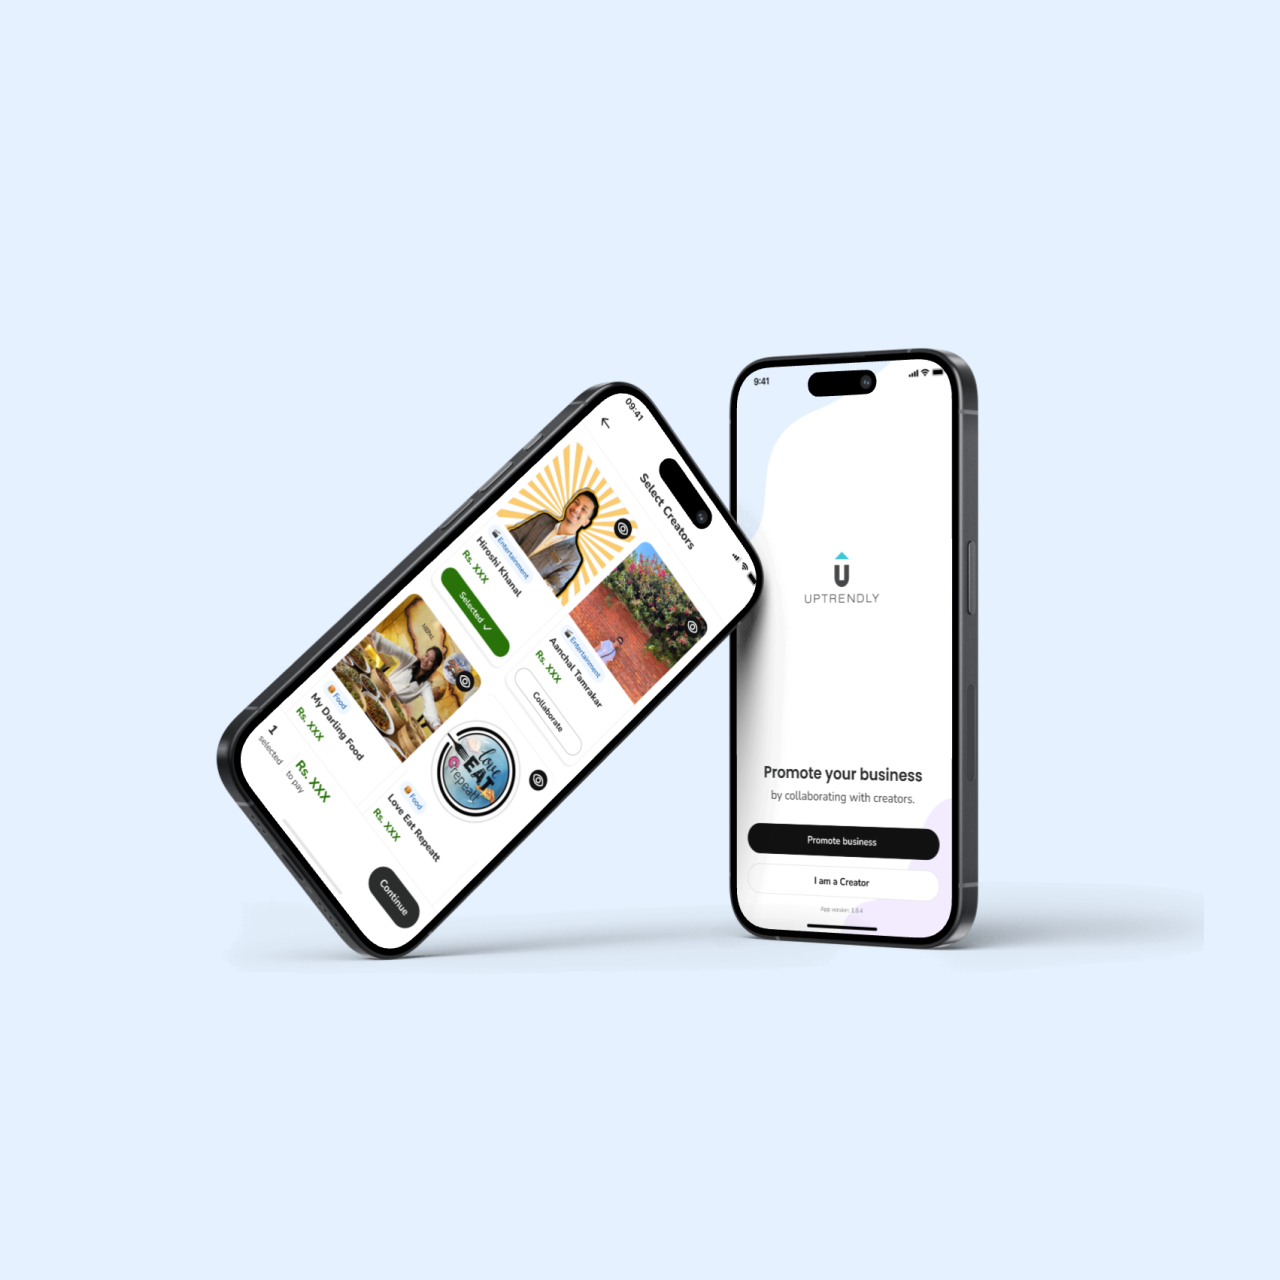
Influencer Marketing · Product Design · Mobile App

Image link takes you to the project details page.